• VisIt Home

  • Nav
  • Home
    • About
    • Get help
    • Examples/Gallery
    • Citing VisIt
    • Contributors
    • Top 50
  • Downloads
    • Releases
    • Example & Test Data
  • Users
    • Get help
    • Using VisIt
    • Python Scripting
    • Tutorials
    • Old tutorials
    • Data input examples
    • Data input manual
    • User's Wiki
    • Science stories
    • LLNL/WCI pages
  • Developers
    • Dev docs
    • Dev resources
    • Reader tutorial
    • Advanced data input
    • Nightly tests
  • News
    • Blog
    • Releases
  • Search
  • Contact

Elevation Map of Europe


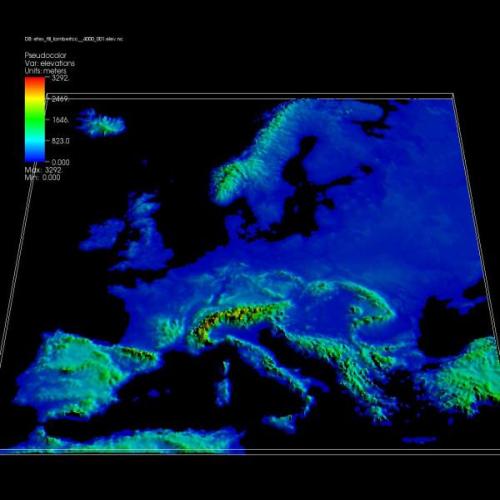
The featured plot shows an elevation map of Europe produced from a rectilinear NetCDF dataset in which cells at sea level have been removed.

Credits
DataData courtesy of Peter Goldstein Ph.D. LLNL.

Previous Post in EXAMPLES Back to EXAMPLES     Next Post in EXAMPLES

About This Site

»VisIt« is an Open Source, interactive, scalable, visualization, animation and analysis tool for Unix, Windows and Mac More ›

Services
  • Contact
Thanks
  • Jekyll Template

Operated by the Lawrence Livermore National Security, LLC for the Department of Energy's National Nuclear Security Administration (NNSA). Learn about the Department of Energy's Vulnerability Disclosure Program.. Thanks to site theme based on Feeling Responsive.