Star Formation
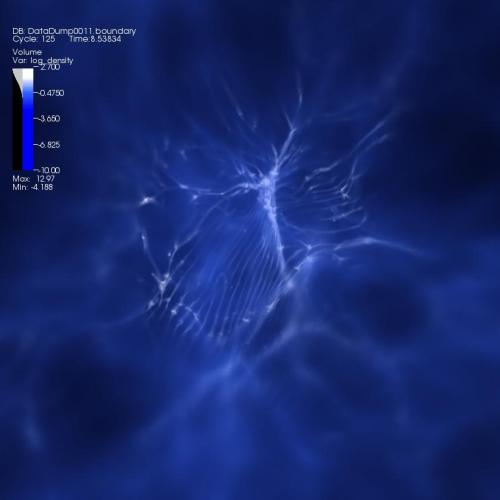
The featured plot is a volume plot of the logarithm of gas/dust density in an Enzo star and galaxy simulation. Regions of high density are white while less dense regions are more blue and also more transparent.
| Image | Image(s) courtesy of Tom Abel Ph.D. and Matthew Turk of the Kavli Institute for Particle Astrophysics and Cosmology |
Previous Post in EXAMPLES Back to EXAMPLES Next Post in EXAMPLES