Example of user-defined plot plugin
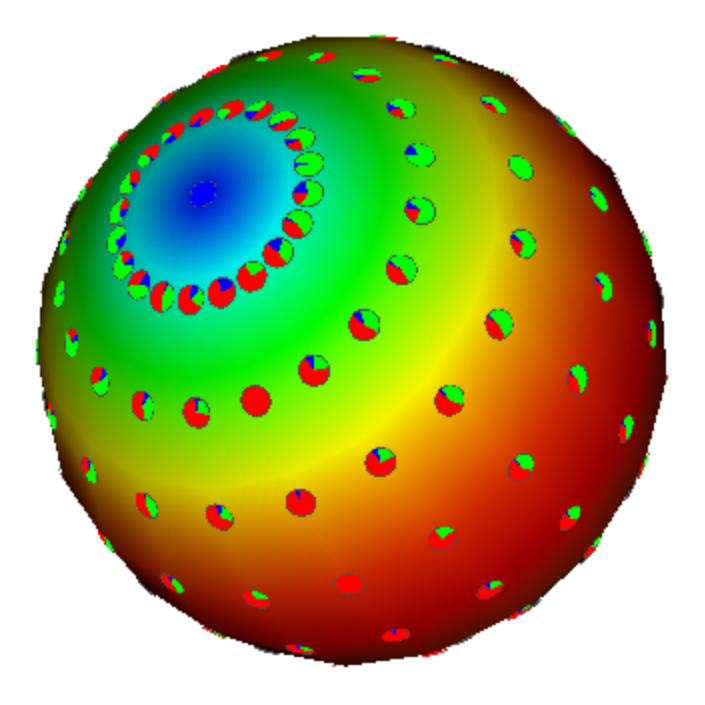
An example of a user-defined plot plugin which plots teeny, tiny little pie-chart plots of the percentage of different species at various points over a 3D surface, typically a globe. There is also a long discussion of further development of this plugin.
| Image | Image(s) courtesy of VisIt user jodyxha |
Previous Post in EXAMPLES Back to EXAMPLES Next Post in EXAMPLES