Laser Filamentation
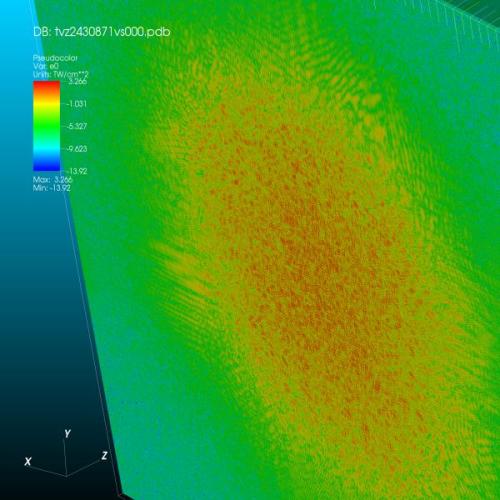
The featured plot is a slightly zoomed in view of a Pseudocolor plot of laser filamentation from a 12.7 billion cell (per time step) rectilinear grid dataset created at LLNL. The dataset is the largest dataset processed with VisIt to date. When the dataset is plotted in VisIt, you can zoom in on the image three more times from this view before you can even see the individual computational cells. VisIt rendered different views of the dataset every 2-3 seconds using 400 processors of LLNL’s Thunder supercomputer.
| Data | Data courtesy of Steven Langer LLNL |
Previous Post in EXAMPLES Back to EXAMPLES Next Post in EXAMPLES