Scatter Plot
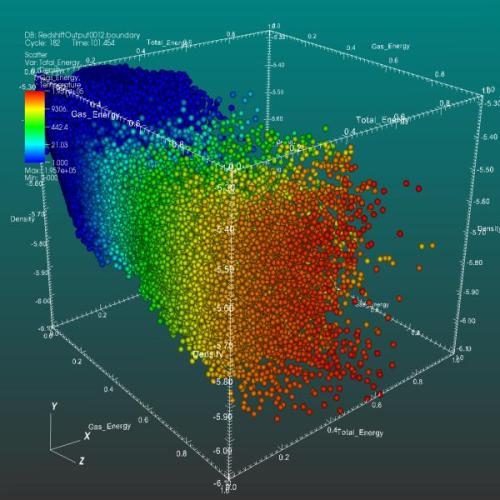
VisIt’s Scatter plot allows you to visualize multivariate data of up to four dimensions. The Scatter plot takes multiple scalar variables and uses them for different axes in phase space. The different variables are combined to form coordinates in the phase space and they are displayed using glyphs and colored using another scalar variable.
Previous Post in EXAMPLES Back to EXAMPLES Next Post in EXAMPLES