fMRI Visualization
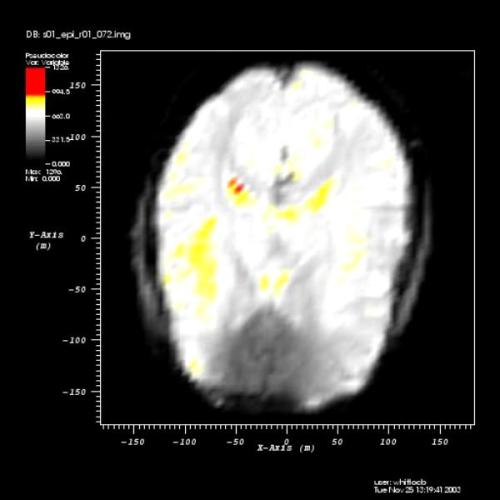
The featured visualization shows a pseudocolor plot highlighting active regions of the brain during fMRI from an ANALYZE dataset.
| Data | Data courtesy of James E. Dobson of the Psychological and Brain Sciences faculty at Dartmouth College. |
Previous Post in EXAMPLES Back to EXAMPLES Next Post in EXAMPLES