Multiple Plots
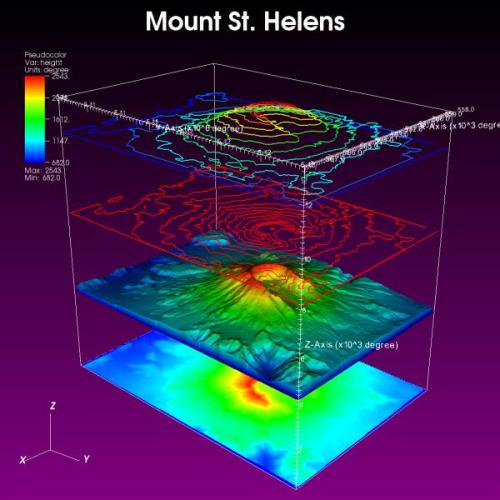
VisIt can put multiple plots in a single visualization, allowing you to visualize data in multiple ways. The featured image shows four representations of Mount St. Helens elevation data from a Digital Elevation Model (DEM) file.
| Data | Data courtesy of USGS |
Previous Post in EXAMPLES Back to EXAMPLES Next Post in EXAMPLES