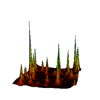
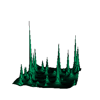
Results of VisIt Regression Test - plots/surface
| Test Case |
Errors |
Images |
| %Diffs |
Maximum |
Baseline |
Current |
Diff Map |
| surface_01 |
0.00 |
0.00 |
 |
| surface_02 |
0.00 |
0.00 |
 |
| surface_03 |
0.00 |
0.00 |
 |
| surface_04 |
0.00 |
0.00 |
 |
| surface_05 |
0.00 |
0.00 |
 |
| surface_06 |
0.00 |
0.00 |
 |
| surface_07 |
0.00 |
0.00 |
 |
| surface_08 |
0.00 |
0.00 |
 |
| surface_09 |
0.00 |
0.00 |
 |
| surface_10 |
0.00 |
0.00 |
 |
Final Return Code: 111


